I’m amazed that the media pays so much attention to violence in Chicago and ignores cities with more violence. If you compare the violent crime rates for large U.S. cities, you’ll find that Chicago is not the most violent by any measure. The Federal Bureau of Investigation (FBI) defines violent crime as murder, rape, robbery, and aggravated assault. The FBI’s Uniform Crime Report (UCR) is published annually and includes the number of violent crimes by city. Though the UCR is published annually, it takes time to verify and finalize the data. As such, the UCR is typically published in September of the following year. As such, the analysis below is for 2014 crimes.
When comparing crime statistics for cities, it is common to calculate violent crime rates using population as a common denominator. To calculate a violent crime rate for a city, we use the following formula:
Violent Crime Rate = (Violent Crimes / Population) x 1,000
For example, you can compare two cities (City A and City B) as follows:
City A: (10 violent crimes / 10,000 people) = 0.001 x 1,000 = 1 violent crime per 1,000 people
City B: (10 violent crimes / 100,000 people) = 0.0001 x 1,000 = 0.1 violent crime per 1,000 people
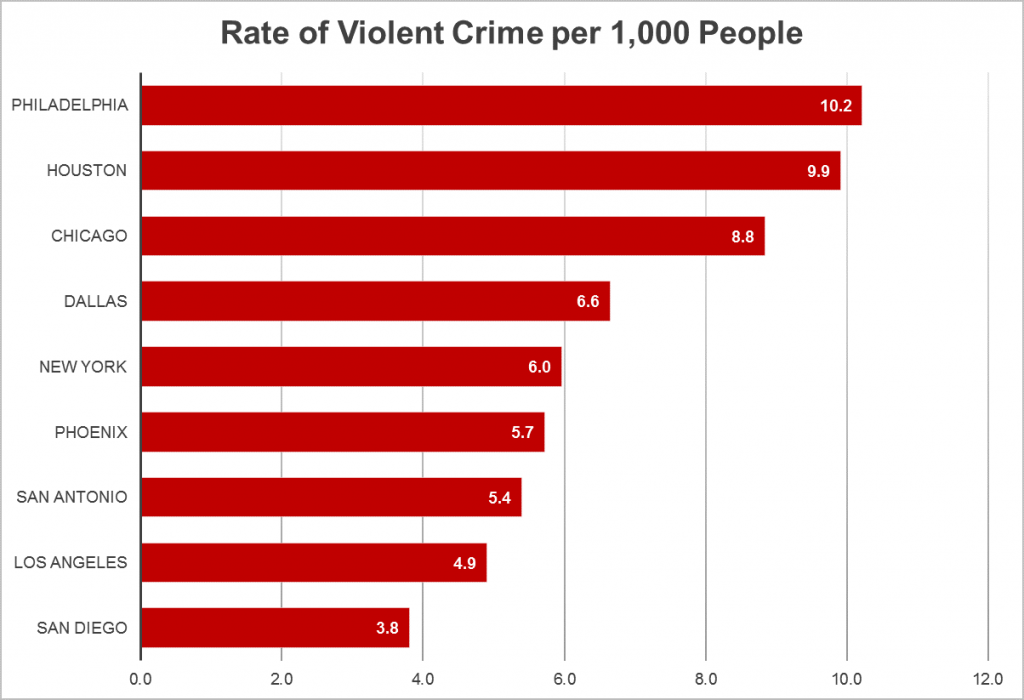
The graph below shows the violent crime rate for nine of the 10 most populous U.S. cities. Las Vegas is in the top 10 most populous cities, but was excluded because the Las Vegas Metropolitan Police Department covers a far larger geographic area (7,560 square miles) as compared to the other cities in this analysis.

So the above graph shows that there is significant variation in violent crime risk among U.S. cities based population, and Chicago is not the worst as the media would have you believe. But what if the media was using a different measure? What if they were using geographic size rather than population? If we calculate the violent crime rate for the same cities using geographic size rather than population, would Chicago be the most violent?
For this analysis, we need to tweak the violent crime rate formula as follows:
Violent Crime Rate = (Violent Crimes / Square Miles)
For example, you can compare two cities (City A and City B) as follows:
City A: (10 violent crimes / 100 square miles) = 0.1 violent crime per square mile
City B: (10 violent crimes / 1,000 square miles) = 0.01 violent crime per square mile
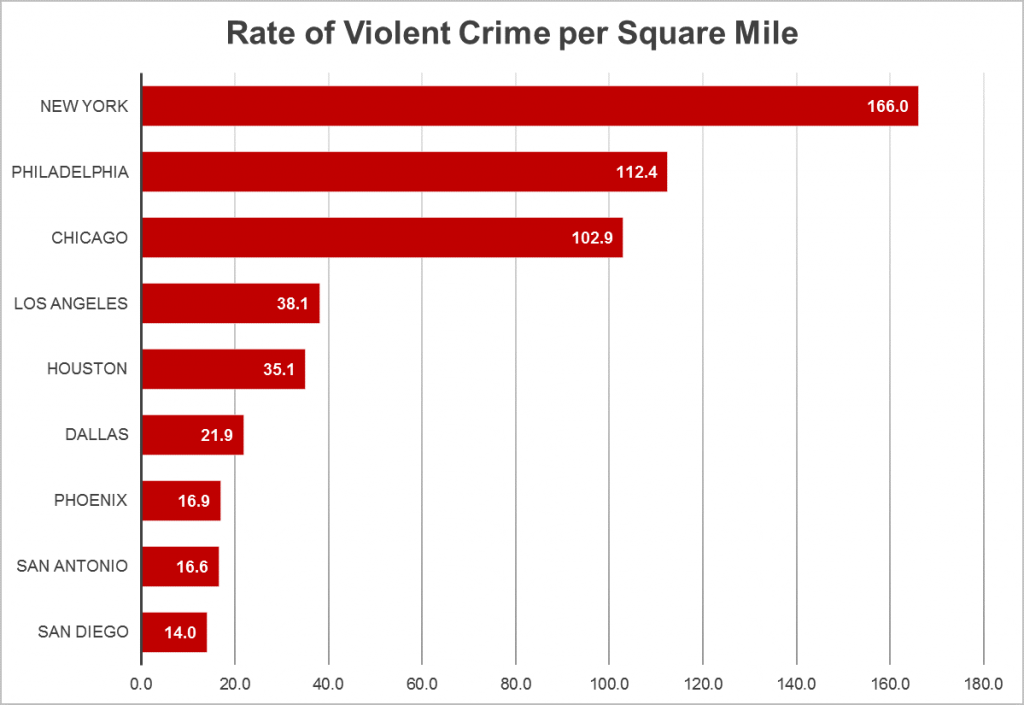
The graph below shows the violent crime rate by geographic size for the same nine U.S. cities.

So violent crime by geographic size does not put Chicago on top either.
With all of the above in mind, it’s important to remember that the most recent UCR (for 2014 at the time of this post) is always several months behind. The media may be reacting to non-UCR sources such as crime statistics published by the Chicago Police Department (CPD). However, at the time of this post, the most recent CPD annual crime report on their website was for 2011.


